If this document does not correspond to your current software version, you can go to Download Center to find other available document versions.

QNAP

QuTS hero 5.0.x

Download (PDF)

Dashboard

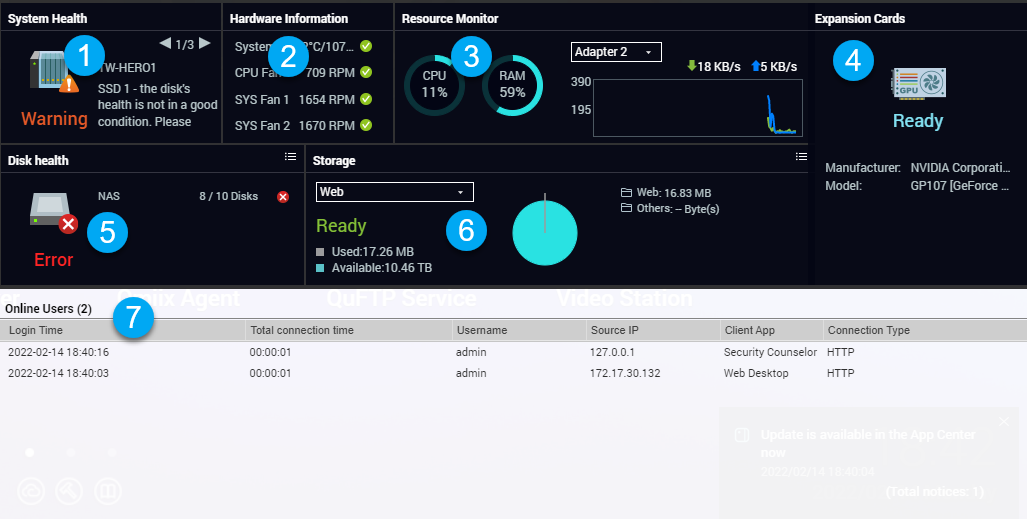
The dashboard opens in the lower right corner of the desktop.

Tip:

You can click and drag a section onto any area of the desktop.

No.

Section

Displayed Information

User Actions

1

System Health

  • NAS name

  • Uptime (number of days, hours, minutes and seconds)

  • Health status

Click the heading to open Control Panel > System > System Status > System Information.

If disk-related issues occur, click the heading to open Storage & Snapshots.

2

Hardware Information

  • System temperature

  • System temperature

  • CPU fan speed

  • System fan speed

Click the heading to open Control Panel > System > System Status > Hardware Information.

3

Resource Monitor

  • CPU usage in %

  • Memory usage in %

  • Network upload and download speeds for each adapter.

Click the heading to open Control Panel > System > Resource Monitor > Overview.

4

Expansion Cards

For each expansion card:

  • Assignment (or "Ready" if unassigned)

  • Manufacturer

  • Model

  • Memory usage

  • GPU usage

  • Fan speed

  • Temperature

Click the heading to open Control Panel > System > Hardware > Expansion Cards.

5

Disk Health

  • Number of installed disks

  • Health status of installed disks

  • Number of VJBOD disks

  • Health status of VJBOD disks

  • Click the heading to open the Disk Health screen in Storage & Snapshots.

  • Click to switch between disk and NAS information.

  • Click a disk name to view the following information for each installed disk:

    • Capacity/size

    • Temperature

    • Health status

  • Click Details to open Storage & Snapshots > Overview.

6

Storage

For each shared folder:

  • Status

  • Used space

  • Available space

  • Folder size

For each storage pool:

  • Status

  • Used space

  • Available space

  • Shared folder size

For each LUN:

  • Status

  • Used space

  • Available space

  • Click the heading to open the Storage Resource screen in the Resource Monitor window.

  • Click to switch between shared folder and storage pool information.

7

Online Users

  • Login time

  • Total connection time

  • Username

  • IP address

  • Client app

  • Connection type

Click the heading to open Control Panel > System > QuLog Center > Online Users.